Low Latency
These tables show what performance you can expect from USB 3.2 Gen 1 (5 Gbps) connection with an OAK camera. XLink chunking was
disabled for these tests (pipeline.setXLinkChunkSize(0)). For an example code, see Latency measurement.
Note
To enable 10Gbps USB3 mode (when using a USB 3.2 Gen 2 compliant cable), you have to explicitly set it in Device constructor:
with dai.Device(pipeline, maxUsbSpeed=dai.UsbSpeed.SUPER_PLUS) as device:
What |
Resolution |
FPS |
FPS set |
Latency [ms] |
Bandwidth |
Histogram |
|---|---|---|---|---|---|---|
Color (isp) |
1080P |
60 |
60 |
33 |
1.5 Gbps |
|
Color (isp) |
4K |
28.5 |
30 |
150 |
2.8 Gbps |
|
Color (isp) |
4K |
26 |
26 |
83 (Std: 3.6) |
2.6 Gbps |
/ |
Mono |
720P/800P |
120 |
120 |
24.5 |
442/482 Mbps |
|
Mono |
400P |
120 |
120 |
7.5 |
246 Mbps |
Below are the same tests, but also with OAK PoE camera, which uses Gigabit ethernet link. The camera was connected directly to the computer, without any switches or routers in between. Power was supplied via M8 connector. oak_bandwidth_test.py results: 797 mbps downlink, 264 mbps uplink. oak_latency_test.py results: Average: 5.2 ms, Std: 6.2.
What |
Resolution |
FPS |
FPS set |
PoE Latency [ms] |
USB Latency [ms] |
Bandwidth |
|---|---|---|---|---|---|---|
Color (isp) |
1080P |
25 |
25 |
51 |
33 Std: 0.8 |
622 Mbps |
Color (isp) |
4K |
8 |
8 |
148 |
80 Std: 1.2 |
530 Mbps |
Color (isp) |
4K |
8.5 |
10 |
530 |
80 Std: 1.3 |
663 Mbps |
Mono |
400P |
90 |
90 |
12 Std: 5.0 |
8 Std: 0.47 |
184 Mbps |
Mono |
400P |
110 |
110 |
16 Std: 9.4 |
8 Std: 0.45 |
225 Mbps |
We set lower FPS for the POE measurements due to bandwidth constraints. For example, 4K 8 FPS had 150ms latency, while 4K 10FPS had 530ms latency, as link was saturated.
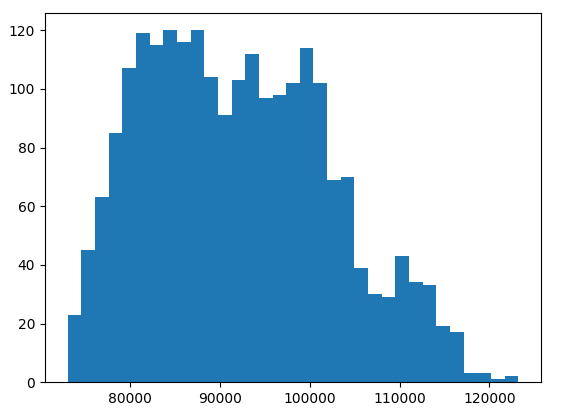
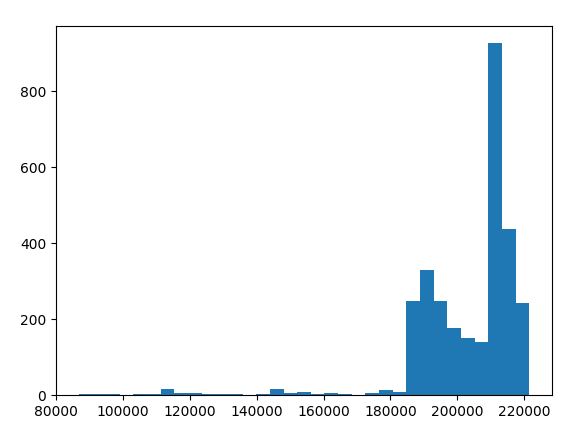
Latency is measured time between frame timestamp (
imgFrame.getTimestamp()) and host timestamp when the frame is received (dai.Clock.now()).Histogram shows how much Time-to-Host varies frame to frame. Y axis represents number of frame that occurred at that time while the X axis represents microseconds.
Bandwidth is calculated bandwidth required to stream specified frames at specified FPS.
Encoded frames
What |
Resolution |
FPS |
FPS set |
Time-to-Host [ms] |
Histogram |
|---|---|---|---|---|---|
Color video H.265 |
4K |
28.5 |
30 |
210 |
|
Color video MJPEG |
4K |
30 |
30 |
71 |
|
Color video H.265 |
1080P |
60 |
60 |
42 |
|
Color video MJPEG |
1080P |
60 |
60 |
31 |
|
Mono H.265 |
800P |
60 |
60 |
23.5 |
|
Mono MJPEG |
800P |
60 |
60 |
22.5 |
|
Mono H.265 |
400P |
120 |
120 |
7.5 |
|
Mono MJPEG |
400P |
120 |
120 |
7.5 |
You can also reduce frame latency by using Zero-Copy branch of the DepthAI. This will pass pointers (at XLink level) to cv2.Mat instead of doing memcopy (as it currently does), so performance improvement would depend on the image sizes you are using. (Note: API differs and not all functionality is available as is on the message_zero_copy branch)
PoE latency
On PoE, the latency can vary quite a bit due to a number of factors:
Network itself. Eg. if you are in a large network with many nodes, the latency will be higher compared to using a direct connection.
There’s a bottleneck in bandwidth:
Perhaps some network link is 10mbps/100mbps instead of full 1gbps (due to switch/network card..). You can test this with PoE Test script (
speedshould be 1000).Network/computer is saturated with other traffic. You can test the actual bandwidth with OAK bandwidth test script. With direct link I got ~800mbps downlink and ~210mbps uplink.
Computer’s Network Interface Card settings, documentation here
100% OAK Leon CSS (CPU) usage. The Leon CSS core handles the POE communication (see docs here), and if the CPU is 100% used, it will not be able to handle the communication as fast as it should. Workaround: See CPU usage docs.
Another potential way to improve PoE latency would be to fine-tune network settings, like MTU, TCP window size, etc. (see here for more info)
Bandwidth
With large, unencoded frames, one can quickly saturate the bandwidth even at 30FPS, especially on PoE devices (1gbps link):
4K NV12/YUV420 frames: 3840 * 2160 * 1.5 * 30fps * 8bits = 3 gbps
1080P NV12/YUV420 frames: 1920 * 1080 * 1.5 * 30fps * 8bits = 747 mbps
720P NV12/YUV420 frames: 1280 * 720 * 1.5 * 30fps * 8bits = 331 mbps

1080P RGB frames: 1920 * 1080 * 3 * 30fps * 8bits = 1.5 gbps

800P depth frames: 1280 * 800 * 2 * 30fps * 8bits = 492 mbps
400P depth frames: 640 * 400 * 2 * 30fps * 8bits = 123 mbps

800P mono frames: 1280 * 800 * 1 * 30fps * 8bits = 246 mbps
400P mono frames: 640 * 400 * 1 * 30fps * 8bits = 62 mbps
The third value in the formula is byte/pixel, which is 1.5 for NV12/YUV420, 3 for RGB, and 2 for depth frames, and 1 for mono (grayscale) frames. It’s either 1 (normal) or 2 (subpixel mode) for disparity frames.
A few options to reduce bandwidth:
Encode frames (H.264, H.265, MJPEG) on-device using VideoEncoder node
Reduce FPS/resolution/number of streams
Measuring operation times
If user sets depthai level to trace (see DepthAI debugging level), depthai will log operation times for each node/process, as shown below.
[SpatialDetectionNetwork(1)] [trace] SpatialDetectionNetwork syncing took '70.39142' ms.
[StereoDepth(4)] [trace] Warp node took '2.2945' ms.
[system] [trace] EV:0,S:0,IDS:27,IDD:10,TSS:2,TSN:601935518
[system] [trace] EV:0,S:1,IDS:27,IDD:10,TSS:2,TSN:602001382
[StereoDepth(4)] [trace] Stereo took '12.27392' ms.
[StereoDepth(4)] [trace] 'Median+Disparity to depth' pipeline took '0.86295' ms.
[StereoDepth(4)] [trace] Stereo post processing (total) took '0.931422' ms.
[SpatialDetectionNetwork(1)] [trace] NeuralNetwork inference took '62.274784' ms.
[StereoDepth(4)] [trace] Stereo rectification took '2.686294' ms.
[MonoCamera(3)] [trace] Mono ISP took '1.726888' ms.
[system] [trace] EV:0,S:0,IDS:20,IDD:25,TSS:2,TSN:616446812
[system] [trace] EV:0,S:1,IDS:20,IDD:25,TSS:2,TSN:616489715
[SpatialDetectionNetwork(1)] [trace] DetectionParser took '3.464118' ms.
Reducing latency when running NN
In the examples above we were only streaming frames, without doing anything else on the OAK camera. This section will focus on how to reduce latency when also running NN model on the OAK.
1. Increasing NN resources
One option to reduce latency is to increase the NN resources. This can be done by changing the number of allocated NCEs and SHAVES (see HW accelerator docs here). Compile Tool can compile a model for more SHAVE cores. To allocate more NCEs, you can use API below:
import depthai as dai

pipeline = dai.Pipeline()
# nn = pipeline.createNeuralNetwork()
# nn = pipeline.create(dai.node.MobileNetDetectionNetwork)
nn = pipeline.create(dai.node.YoloDetectionNetwork)
nn.setNumInferenceThreads(1) # By default 2 threads are used
nn.setNumNCEPerInferenceThread(2) # By default, 1 NCE is used per thread
Models usually run at max FPS when using 2 threads (1 NCE/Thread), and compiling model for AVAILABLE_SHAVES / 2.
Example of FPS & latency comparison for YoloV7-tiny:
NN resources |
Camera FPS |
Latency |
NN FPS |
|---|---|---|---|
6 SHAVEs, 2x Threads (1NCE/Thread) |
15 |
155 ms |
15 |
6 SHAVEs, 2x Threads (1NCE/Thread) |
14 |
149 ms |
14 |
6 SHAVEs, 2x Threads (1NCE/Thread) |
13 |
146 ms |
13 |
6 SHAVEs, 2x Threads (1NCE/Thread) |
10 |
141 ms |
10 |
13 SHAVEs, 1x Thread (2NCE/Thread) |
30 |
145 ms |
11.6 |
13 SHAVEs, 1x Thread (2NCE/Thread) |
12 |
128 ms |
12 |
13 SHAVEs, 1x Thread (2NCE/Thread) |
10 |
118 ms |
10 |
2. Lowering camera FPS to match NN FPS
Lowering FPS to not exceed NN capabilities typically provides the best latency performance, since the NN is able to start the inference as soon as a new frame is available.
For example, with 15 FPS we get a total of about 70 ms latency, measured from capture time (end of exposure and MIPI readout start).
This time includes the following:
MIPI readout
ISP processing
Preview post-processing
NN processing
Streaming to host
And finally, eventual extra latency until it reaches the app
Note: if the FPS is increased slightly more, towards 19..21 FPS, an extra latency of about 10ms appears, that we believe is related to firmware. We are actively looking for improvements for lower latencies.
3. NN input queue size and blocking behavior
If the app has detNetwork.input.setBlocking(False), but the queue size doesn’t change, the following adjustment
may help improve latency performance:
By adding detNetwork.input.setQueueSize(1), while setting back the camera FPS to 40, we get about 80.. 105ms latency.
One of the causes of being non-deterministic is that the camera is producing at a different rate (25ms frame-time),
vs. when NN has finished and can accept a new frame to process.